Performs the average pairwise distance test on the collection of gene sets. If t (number of gene sets in the collection) is 1, then the statistic is 0 and the p-value is 1.
| Parameters: |
|
|---|
Test:
For the definition of the test statistic used by the average pairwise distance test, see avg_pair_dist_ratio(). The average pairwise distance test compares the average pairwise distance test statistic of the collection on the original and permuted PPI networks.
Note: Genes that are not in the graph G or are in different connected components than the other genes are given an average pairwise distance of 1e100. These genes should be removed before using the average pairwise distance test.
>>> import networkx as nx
>>> collection = [["G1", "G2"], ["G3", "G4"]]
>>> G = nx.Graph()
>>> G.add_edges_from([("G1", "G2"), ("G3", "G4"), ("G2", "G5"), ("G4", "G5")])
>>> Hs =[ nx.double_edge_swap(G.copy(), nswap=10, max_tries=1e75) for i in range(10) ]
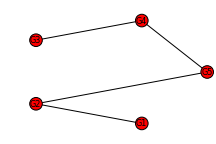
>>> nx.draw_circular(G, node_size=125, font_size=8)
>>> avg_pair_dist_test(collection, G, Hs)
(0.33, 0.10)
See also: avg_pair_dist_ratio(), eval_gene_sets_by_dist(), direct_interactions_test().